eBPF
How to trace code directly with eBPF
Mihalis Tsoukalos explains how to take advantage of eBFP with a range of different programming languages.
OUR EXPERT
Mihalis Tsoukalos is the author of Go Systems Programming and Mastering Go, and is currently working with Time Series.
QUICK TIP
Tools such as nm, objdump and readelf can help you check whether the symbol table is present in a binary executable. If there is no symbol table, most of the time the best solution is to recompile the software with the appropriate command-line options.
Part Six!
Don’t miss next issue, subscribe on page 16!
Tracing programming languages is a relatively difficult task, but we’re not going to let that stop us, and are going to learn the principles of tracing C, Java and Bash shell scripts. First, though, let’s talk a little more about eBPF internals and how to expose eBPF metrics to Prometheus.
You are not going to need this information on a daily basis, especially if you are not developing eBPF tools from scratch, but it might come handy when you want to know what is happening behind the scenes when executing eBPF code.
Compared to the original BPF, eBPF uses 64-bit words instead of 32-bit ones, has 11 registers instead of just two, offers more storage and can operate not only with packets but with multiple event sources. As mentioned in a previous eBPF tutorials, eBPF supports kprobes, which offer kernel dynamic instrumentation, uprobes for user-level dynamic instrumentation, and tracepoints that support kernel static instrumentation and are hard-coded into the Linux kernel code (/usr/ src/linux/include/trace/events/block.h). Because tracepoints make your code more stable than kprobes, use tracepoints whenever possible. eBPF code attaches to one or more probes or tracepoints and executes the predefined bytecode each time a relevant event takes place. Put simply, kernel events are mapped to the BPF bytecode. Before mapping any BPF bytecode to kernel events, the BPF verifier, which is implemented using around 10,000 lines of C code, makes sure that the code is safe to execute. All this takes place in user space.
As with most programming languages, each eBPF program – which is in plain text format – is processed by a parser before constructing the abstract syntax tree, used for checking the validity of the code before it gets converted into bytecode and executed as machine code on the CPU. If you have misspelled a variable or a probe name, the semantic analyser is going to catch the relevant errors and print the appropriate error messages.
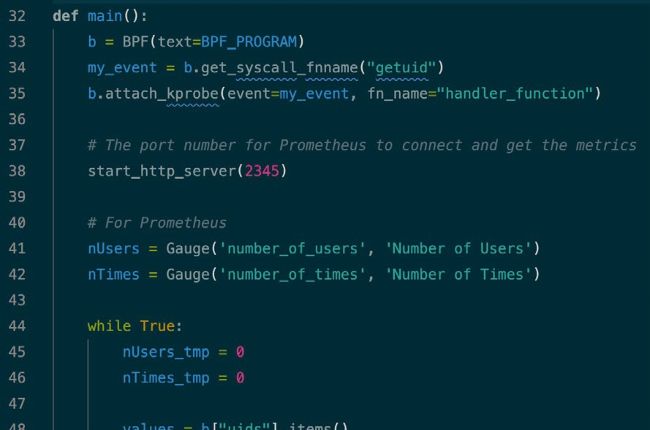
Figure 1: The main() function of the Python script used for getting eBPF metrics and exposing them to Prometheus via an HTTP interface.