Monitor systems and Docker deployments
Even when locked-down Mihalis Tsoukalos can still keep a close eye on all of his Linux systems and Docker images with Netdata.
Mihalis Tsoukalos
OUR EXPERT
Mihalis Tsoukalos is a DataOps engineer and a technical writer. He is also the author of Go Systems Programming and Mastering Go, 2nd edition.
Welcome to Netdata, software for distributed real-time performance and health monitoring of UNIX machines. Don’t you dare turn that page! A key advantage of Netdata is that it collects all of its metrics without introducing too much load on to the Linux machine that it runs on. In fact, most of the times you’ll forget that Netdata is running on a Linux machine - it’s only after you look at its impressive visualisations that you’ll remember the software is collecting, processing and visualising all these metrics! Another Netdata advantage is that it carries out real-time monitoring, so you can see what’s happening on the Linux machine at that time.
Install Netdata using your package manager. On a Debian or Ubuntu Linux system you can install Netdata by executing apt install netdata. The configuration directory of Netdata is /etc/netdata, but you’ll also find plenty of useful files inside /usr/lib/netdata. By default, Netdata listens to http://localhost:19999, which is the first thing that you should try, to ensure that the Netdata installation was successful.
The screenshot (right) shows the initial default screen, which is full of information. If you’re running Netdata on your own Linux machine, take the time to look at the Netdata visualisations. If you want to make Netdata available over your local network or the Internet, then you should change the value of “bind socket to IP” in the /etc/netdata/netdata.conf configuration file to the external IP of the machine and restart Netdata by executing systemctl restart netdata for the change to take effect. You can identify the version of Netdata you’re using by looking at the lower right-hand corner of the Netdata screen. We’re using Netdata version 1.12.0 in this tutorial.
QUICK TIP
Find out more about netdata at www.netdata.cloud and the documentation of netdata at https://docs.netdata.cloud. The GitHub repository of netdata is located at https://github.com/netdata/netdata and the netdata Docker image can be found at https://hub.docker.com/r/netdata/netdata.
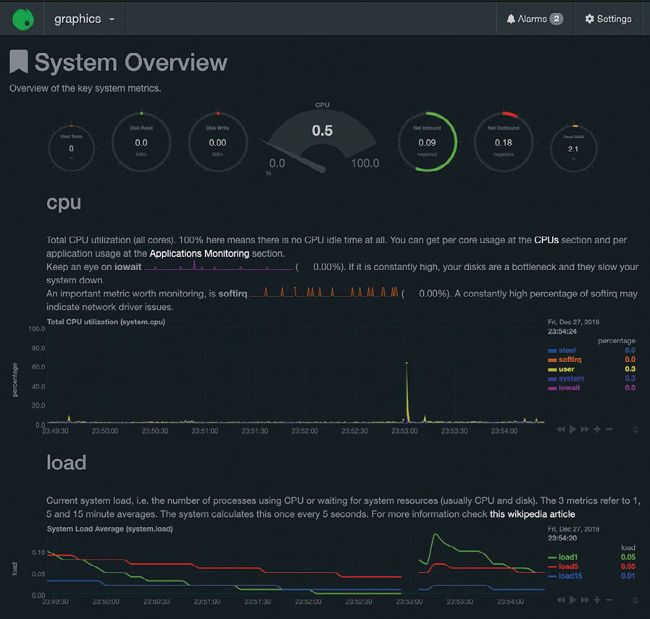
The initial screen of the Netdata web interface, which contains a plethora of information and is divided into three main parts.
Measure the metrics
Netdata can collect and display a plethora of metrics - more than 1,000. The list of metrics includes those on the entire system, the CPUs, the memory, the disks, TCP/IP networking, Systemd, specific applications, users, the firewall, running containers as well as the operation of Netdata itself.
The good news is that if you want to monitor something that’s not directly supported by Netdata, you can create you own metric collector using the Netdata plugin API. You can find more about that capability at https://github.com/netdata/netdata/tree/master/collectors/plugins.d. The plugin API won’t be discussed in much detail in this tutorial.