eBPF
Observability of the kernel and containers
Barely able to contain himself, Mihalis Tsoukalos explains how to use eBPF to monitor applications, the Linux kernel and containers.
OUR EXPERT
Mihalis Tsoukalos is currently working on Time Series. You can reach him at: @mactsouk.
For our final delve into eBPF, we’re tackling applications, the kernel and Docker containers. At the end of the day, all Linux machines execute code for applications or services, and we want to be able to understand why our programs are running slowly or misbehaving. Although the issue is usually with the app itself, there are times when the Linux kernel is misconfigured or is running slowly due to system limitations (memory, hard disk, network and so on). Additionally, many apps are now executed as Docker containers. So, in this last tutorial of the eBPF series we’re here to get you started with observability at the app, kernel or container level. While reading, please bear in mind that everything you have learned so far about eBPF in this series can be used for application, kernel and container observability.
Observability strategy
When you need to perform application observability, there is no single tool or technique that is going to solve all your performance issues. The key, and the difficulty, to application observability is not knowing all the available tools but choosing the appropriate ones. This section presents a generic strategy for dealing with app observability. The proposed steps are:
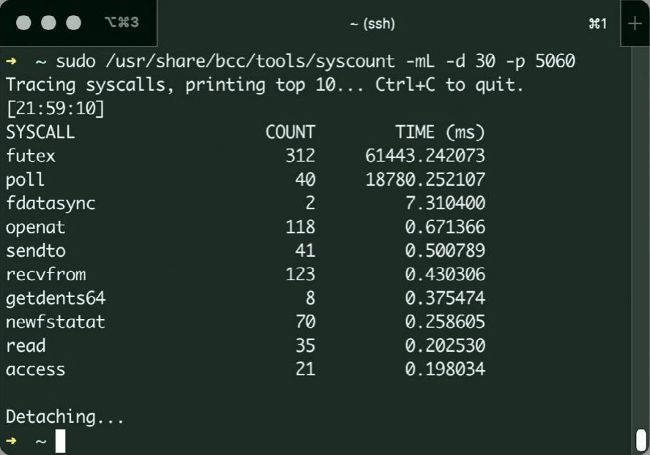
Figure 2: The output of syscount when used for tracing the operation of a MariaDB server for a period of 30 seconds.
QUICK TIP
Get the tools and code pack to support this tutorial from: https://bit.ly/ lxf301code
1. Ensure you understand the way the desired application operates, whether it accepts network connections or not, and if it performs lots of file I/O, and so on. This is going to help you select the appropriate eBPF tools for the job.
2. Get a good overview of the system and its performance using a combination of traditional Unix tools and eBPF utilities.
3. Take a closer look at the performance of the entire Linux system and maybe look into the kernel operation a little. Are there enough resources?
4. If possible, learn more about the internals of the application you are working with.
5. Find the uprobes supported by the application and
whether the provided binary is stripped or not. You might need to recompile your application.
STRATEGY FOR KERNEL OBSERVABILITY
Here are some basic steps to help you identify performance issues with your Linux kernel:
1. Check whether there are existing tools or tracepoints that instrument the event of interest.
2. Feel free to create a separate C program that replicates the performance issue. When working with the kernel, problem isolation can save you lots of time.
3. If this is a performance issue, try CPU profiling to resolve the situation.
4. If CPU profiling is not enough, use a CPU flame graph to get a better idea of what is happening.
5. If this is a filesystem issue, trace appropriate functions. For example, if you have an ext4 filesystem, count all the ext4_* function calls.
6. If you still want more details, use stack traces from kernel functions.
7. If you are still unsure, start displaying function arguments, count function return values and measure function latencies.
8. If everything else fails, begin writing your own custom tools or modify existing eBPF code and rethink your strategy in the process, because you might be doing something wrong.