PRO TIP
USING THE ANALYSER
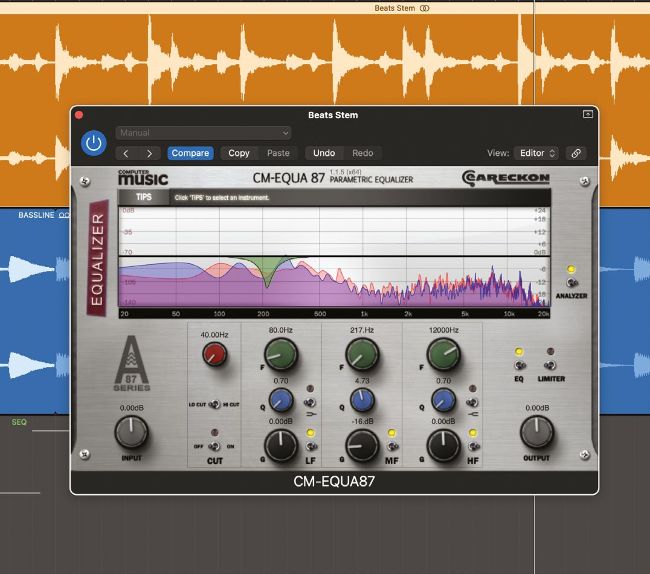
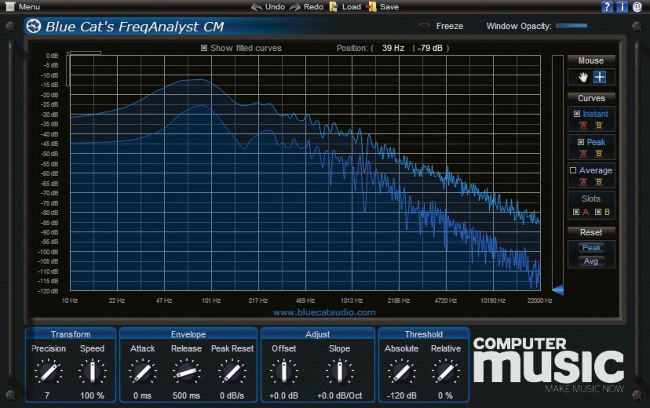
One of the greatest benefits of mixing in a DAW is the plethora of available analysis tools, and EQs with their own in-built frequency spectrum analysers are a perfect example. At their best, these will show you a graphic representation of your EQ curve superimposed on a real time analysis curve (a good example is the EaReckon CM EQUA-87 equaliser in the CM Suite). This combo not only helps you EQ but also provides a great way to learn and understand the frequency make up of different sounds. If you don’t have a suitable standalone analyser option in your DAW, why not try our CM Suite plugin FreqAnalyst CM from Blue Cat. Of course, the visual feedback is only useful if we can interpret it properly. On the horizontal axis you’ll find frequency, with amplitude on the vertical axis. The frequency scale is logarithmic, and each doubling of frequency, so each octave, is evenly spaced out. This puts 500Hz roughly in the middle, and means we’ll often be viewing fundamental frequencies to the left hand side and higher harmonics to the right. Lower frequencies generate more obvious curves, and here you should be able to distinguish individual notes in a bass part.