EBPF
Use eBPF to keep tabs on your CPU
The ever-knowledgeable Mihalis Tsoukalos explains how to use eBPF and the tools of the BCC project to monitor your system’s processor.
Part Two!
Did you miss part one? Get hold of it on page 60
OUR EXPERT
Mihalis Tsoukalos is a systems engineer and a technical writer. You can reach him at @mactsouk.
We’re continuing our dive into the notoriously complex Extended Berkeley Packet Filter (eBPF) feature of the Linux kernel. In this part we’ll be tackling processor monitoring and everything that involves. Bear in mind that you should read part one of this eBPF tutorial from the previous issue to learn how to enable eBPF and install the tools of the BCC project. Additionally, all commands discussed here need root privileges to be executed, which makes perfect sense because we’re working in kernel space.
We’ll be using the term observability in this series of tutorials, so let’s define it. Observability is about understanding a system by observing it, rather than modifying it, using sampling tools to trace it. So, in this tutorial we’ll observe the CPU and its cores. We’ll begin this tutorial by presenting a generic eBPF utility: bpftool.
Task listing
Let’s see how you can use bpftool for tracing active (loaded) BPF objects. This tool isn’t connected to just CPU observability, but if you’re using eBPF a lot then it provides a handy way of knowing how you’re making use of eBPF on your Linux machine.
Running bpftool without any command line arguments displays a help screen. Here you can see the supported object types: prog, map, cgroup, perf, net, feature and btf. You can get a help screen for each one of them by running bpftool followed by the object type and the word help . The screenshot (above) shows the main help screen of the bpftool command line utility as well as the output of bpftool prog help . Each command can have subcommands. This section is going to use the prog object type only, which enables you to print the BPF commands of a eBPF program.
The bpftool prog show command lists all programs that are running on the current machine. Its output looks similar to the following:
24: kprobe name trace_req_start tag 1dfc28ba8b3dd597 gpl
loaded_at 2022-06-09T22:27:30+0300 uid 0
xlated 112B jited 78B memlock 4096B map_ ids 10
btf_id 260
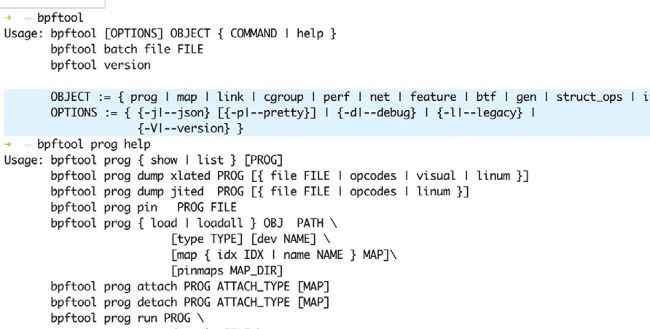
Two of the help screens generated by bpftool, enabling you to discover active eBPF sessions on a Linux machine and display the BPF code.
The first number in each loaded program is the ID of bpftrace, which is going to be used next. Executing the same command with the --json flag and piping the output though jq is going to give you a beautiful output in JSON format, so, just for fun, execute bpftool prog show --json | jq , provided that you have jq already installed on your Linux system.