TIMELION
Visualise complex data in style using Timelion
Simon Quain shows how to visualise Covid-19 statistics and more with freely available open datasets and Timelion, a plugin for Elasticsearch.
Simon Quain
OUR EXPERT
Simon Quain is a site reliability engineer who likes discovering open datasets online to play around with in the Elastic Stack.
You’ve probably heard of Elasticsearch - the search engine that enables you to index and then quickly search through your data. You may have created a few visualisations in Kibana, the GUI for Elasticsearch, pointing and clicking your way through the sleek interface. What you may not have used is a lesser-known visualisation plugin called Timelion.
Timelion is a fantastic visualisation creation tool that makes it possible to write out your queries in its simple and powerful expression language to display graphs. It’s used for displaying time-series data such as population growth or hits to your website. With Timelion, we can calculate moving averages, display the difference between the data for last week and today, and do some basic anomaly detection. It’s a useful tool to know how to work with. Let’s get started.
Installation
If you’re a regular Linux Format reader, there are docker compose examples for setting up a cluster in LXF261. Otherwise installing Elasticsearch and Kibana is relatively straightforward. The only requirement is Java, which you may already have installed. If not a simple sudo apt install default-jre installs it on Debian-based distros or a sudo dnf install java should do the same for the Red Hat family of distros.
Then you just need to go to https://elastic.co/ downloads and download the latest version of Elasticsearch and Kibana for your desired operating system flavour. At the time of writing the link for Kibana is https://artifacts.elastic.co/downloads/kibana/ kibana-7.8.1-linux-x86_64.tar.gz. Then you can extract it with tar -xvzf kibana-7.8.1-linux-x86_64.tar.gz , change into the extracted directory and run ./bin/kibana & to fire up the Kibana instance. When you’ve done exactly the same steps to set up Elasticsearch, replacing ‘kibana’ for ‘elasticsearch’, you should be able to navigate to http://localhost:5601 in your favourite browser and see a shiny new Kibana interface to play around with. If you prefer to install packages with a package manager, the same link as before has information about adding the Elastic repo to your system and installing the Kibana and Elasticsearch packages that way.
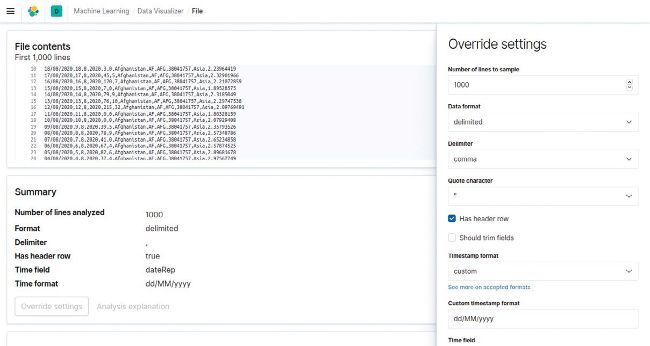
The Data Visualizer makes it easy to get your data into Elasticsearch through the Kibana interface without creating a script.
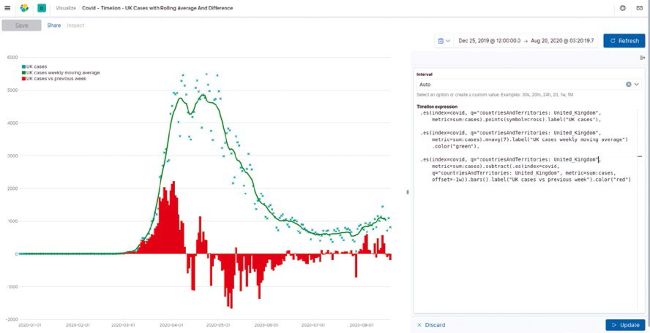
You can superimpose graphs on top of each other and use formatting to get your graphs looking their best.
Get some data
Recent versions of Kibana makes it possible to ingest datasets into our cluster automatically with the Data Visualizer instead of needing to create a script or Logstash config. It can deal with datasets in JSON or CSV format as well as some standard log files such as Apache logs. The only limitation is that they’re less than 100MB in size. This is more than enough for our purposes. We’ll be using the Covid-19 cases worldwide dataset from the EU Open Data Portal at https://data.europa.eu/euodp/en/data/dataset/covid-19coronavirus-data. We downloaded the CSV file from the Resources section of the page. If you have issues, you could choose to download the Excel .xlsx version instead, open with LibreOffice Calc and save it as Text CSV(.csv) format. There’s also a JSON version available for download that you can use as an alternative.