SYSTEM MONITOR
HotPicks
System Monitoring Center Universal Media Server Element Carbonyl Nushell Tonfotos Conjure Space Station 14 Crispy Doom Singlebox Rymdport
System Monitoring Center
Version: 2.8.0 Web: https://github.com/ hakandundar34coding/systemmonitoring-center
Mayank Sharma
isn’t a fan of cryptos, but wonders whether he needs to give them another look, especially when he sees popular, regulated banks crumbling around him.
Most Linux distros ship with decent default system monitoring tools that enable you to M graphically monitor how your system is using hardware resources. The issue is that they’re pretty basic in terms of reporting. They only track and report the parameters that would suit the average user. For instance, while you get processor usage with a default tool, they don’t report the fluctuating CPU frequency.
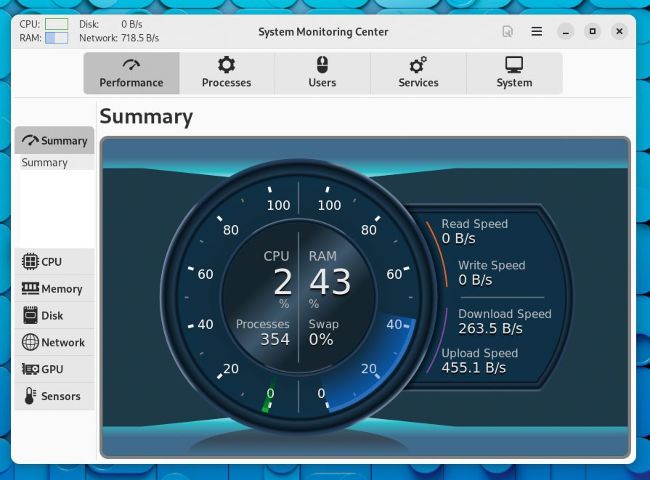
That’s where System Monitoring Center shines. The tool is pretty comprehensive in its monitoring, tracking all the essential system resources in great detail.
The app is available in the repos of some distros, but the version would probably be outdated unless you use Arch. Your best bet is to grab it as the distro-agnostic Flatpak, with flatpak install flathub io.github. hakandundar34coding.system-monitoring-center . The app anchors itself in your distro’s apps menu, and can be fired up with flatpak run io.github. hakandundar34coding.system-monitoring-center . The app has a busier interface than the average system monitoring app, but it’s still pretty intuitive. You can use it to view stats for your computer’s RAM, CPU, GPU, disk and network usage, as well as useful details about other types of sensors. For each of these, the app also offers customisations for further information.
The best thing about System Monitoring Center is that its charts are interactive, which means you can look up performance data on any point. The app has several interesting options, such as the ability to display the average usage or the usage per core, filter system processes by user, and even manage them from within the app. In the same vein, the app enables you to not only view details about the running and stopped services, but also control them.
The app is pretty responsive and claims to be optimised for low CPU usage.
LET’S EXPLORE SMC...
1 Hardware selection options
You can get a performance summary of all the components, or choose a specific one to monitor it in detail.
2 Check details
Besides performance, you can also control processes and services, and view details about the users and the system.
3 Customisation menu
The contents of this menu vary depending on the hardware component you are currently monitoring.
4 Graphs and details
Details of the component being monitored are shown here, with a graph that plots live information.
The app has minimal, but useful general settings. For instance, it lets you tweak the update interval and specify the duration of data, which is something you wouldn’t find in your average system monitoring app.
MEDIA STREAMER
Universal Media Server
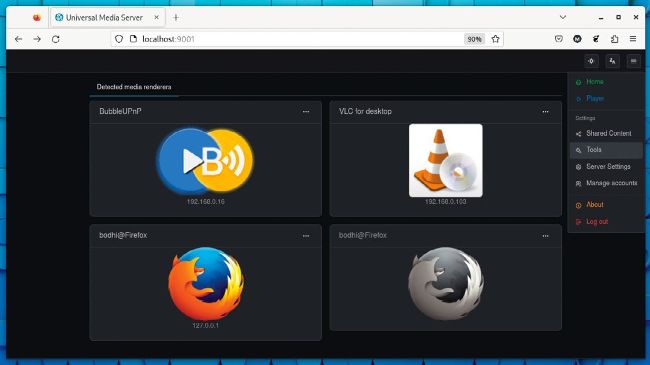
You can also use the BubbleUPnP app to transform your Android smartphone or tablet into a UPnP device.
Version: 13.2.0 Web: www.universalmediaserver.com
With Universal Media Server (UMS), you can stream all kinds of media from your Linux computer via the Universal Plug and Play (UPnP) protocol to any DLNA-compliant device. DLNA is found on popular gaming consoles including the PlayStation and Xbox, and even several smart TVs.