ELASTIC STACK
Plot geolocation data with ELK
Simon Quain reveals how to display local restaurants and their food hygiene ratings on a map with Elasticsearch, Logstash and Kibana, aka ELK
OUR EXPERT
Simon Quain works as a site reliability engineer who likes finding open datasets online to play around with in the Elastic Stack.
B ack in LXF269 we visualised COVID-19 statistics with data from the European Open Data Portal, the search engine Elasticsearch, its GUI Kibana and a little help from Kibana’s new Data Visualizer to get the data into Elasticsearch for us. This time we’ll be parsing the data ourselves with the help of a nifty tool called Logstash. Logstash can take data from an input, do some processing to it and then send it off to a desired output. Logstash is able to work with a wide variety of inputs from Azure Event Hubs to XMPP events. In this article, we’ll be parsing food hygiene ratings for local businesses using open data files from the UK government’s Food Standards Agency. We’ll end by plotting them on a map with Kibana Maps.
To get started with Logstash, go to https://elastic.co/ downloads/logstash and download the latest version of Logstash. At the time of writing this is 7.10.0. We chose the tar.gz download with a direct link of https://artifacts. elastic.co/downloads/logstash/logstash-7.9.2.tar.gz. Once downloaded, you can extract it with tar -xvzf logstash-7.9.2.tar.gz . To use Logstash, you’ll need to have Java installed. You can get it with sudo apt install default-jre for Debian-based distros or sudo yum install java on Red Hat-based ones. After changing into the extracted directory with cd logstash-7.9.2 , you’ll be ready to start processing some data.
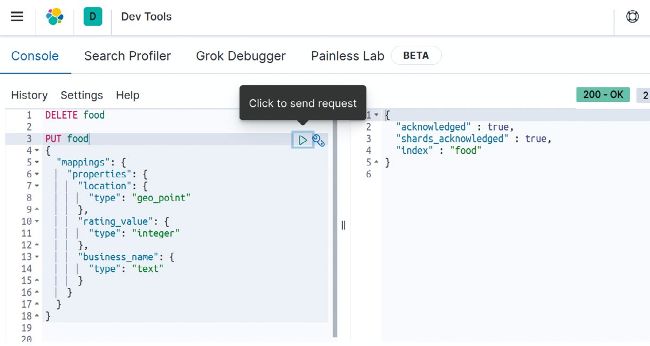
Dev Tools makes it easy to run REST commands against Elasticsearch and has handy features accessible via the spanner icon.
This configuration has an input block that tells Logstash to take whatever is given to it from standard input and an output block which tells it to print it out to standard output. The codec => “rubydebug" line makes the output more human-readable. You can make Logstash run with this config by entering ./bin/logstash -f stdout.conf into your terminal from the root of the extracted logstash directory. After a short wait, you should see Successfully started Logstash API endpoint in the terminal and you can type your favourite sanity test message. We chose the classic “Hello, world!” and after pressing Enter, you should see something like the following:
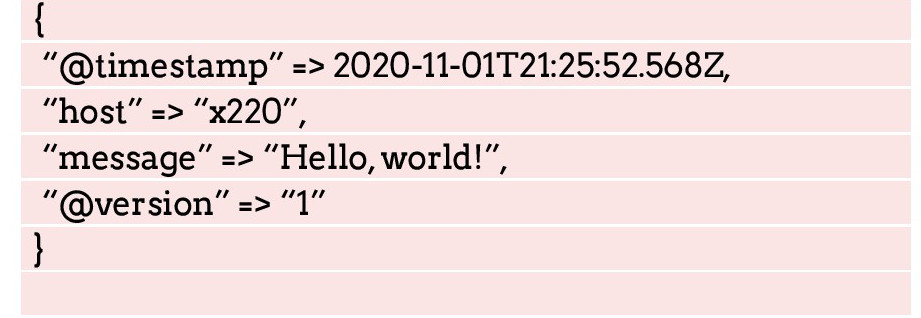
Logstash has taken the line of text you entered and put that in the message field. It’s also added some metadata, such as where and when the input was processed. You can keep entering text followed by the Enter key to see how Logstash processes a new event each time. When you’re bored of that, pressing Ctrl+C will shut down Logstash. Logstash works on a line-by-line basis which makes it particularly powerful with Linux pipes and redirection – something that we’ll take advantage of later.